Many research tools begin as proof-of-concept code written for developers rather than for the people who ultimately need to use them. The 3DO Analyzer project started in exactly that state: a promising algorithm capable of estimating body composition from 3D optical scans, but one that researchers struggled to run.
My role was to transform the system from a developer pipeline into a usable application. By simplifying installation, restructuring the project architecture, and designing a guided interface, the goal was to make the software usable by researchers who had little or no programming experience.
Background
Body composition measurements such as body fat percentage and lean mass are typically collected using DXA scanners. While accurate, DXA machines are expensive, require trained operators, and expose patients to small amounts of radiation.
3D optical scanning offers a more accessible alternative. Scans can be captured using dedicated scanners or even mobile phone applications, making it possible to collect body composition data in research environments where DXA is not available.
The research team had already developed an algorithm capable of predicting body composition from these scans. However, the system existed only as a developer prototype consisting of Python scripts and model files.
When the original developer prepared to leave the lab, I was asked to document the system so that others could continue using it. While learning the workflow, I realized that I had effectively become the only person in the lab able to run the program reliably.
Even experienced researchers struggled with installation and execution. If trained researchers found the system difficult to use, it was unlikely that clinicians would ever adopt it in the future.
The algorithm itself worked. The real problem was usability.
Challenge
The primary users of the system were health researchers analyzing 3D optical scan data. These users had strong domain knowledge in body composition research but limited experience with software development environments.
The existing workflow required users to download the repository from GitHub, configure a development environment, install multiple dependencies, and run several scripts manually in sequence. Each step introduced opportunities for confusion or failure.
Two barriers quickly became clear. The installation process prevented many researchers from even attempting to run the software, and the command-line workflow provided little visibility into whether the program was working correctly or had failed.
The design goal became reducing the system to a workflow that researchers could run confidently without needing developer knowledge.
Process
Before designing a graphical interface, I focused on simplifying the underlying system. The original repository stored nearly every file in a single directory, which made it difficult for users to understand the structure of the project. I reorganized the repository so that source code, prediction models, and data were clearly separated, making the system easier to navigate and maintain.
Next, I simplified the setup process. Instead of asking users to manually configure environments and dependencies, I introduced a setup script that installs everything automatically. I also streamlined the processing pipeline so that a helper script could run the full analysis sequence without requiring users to remember multiple commands.
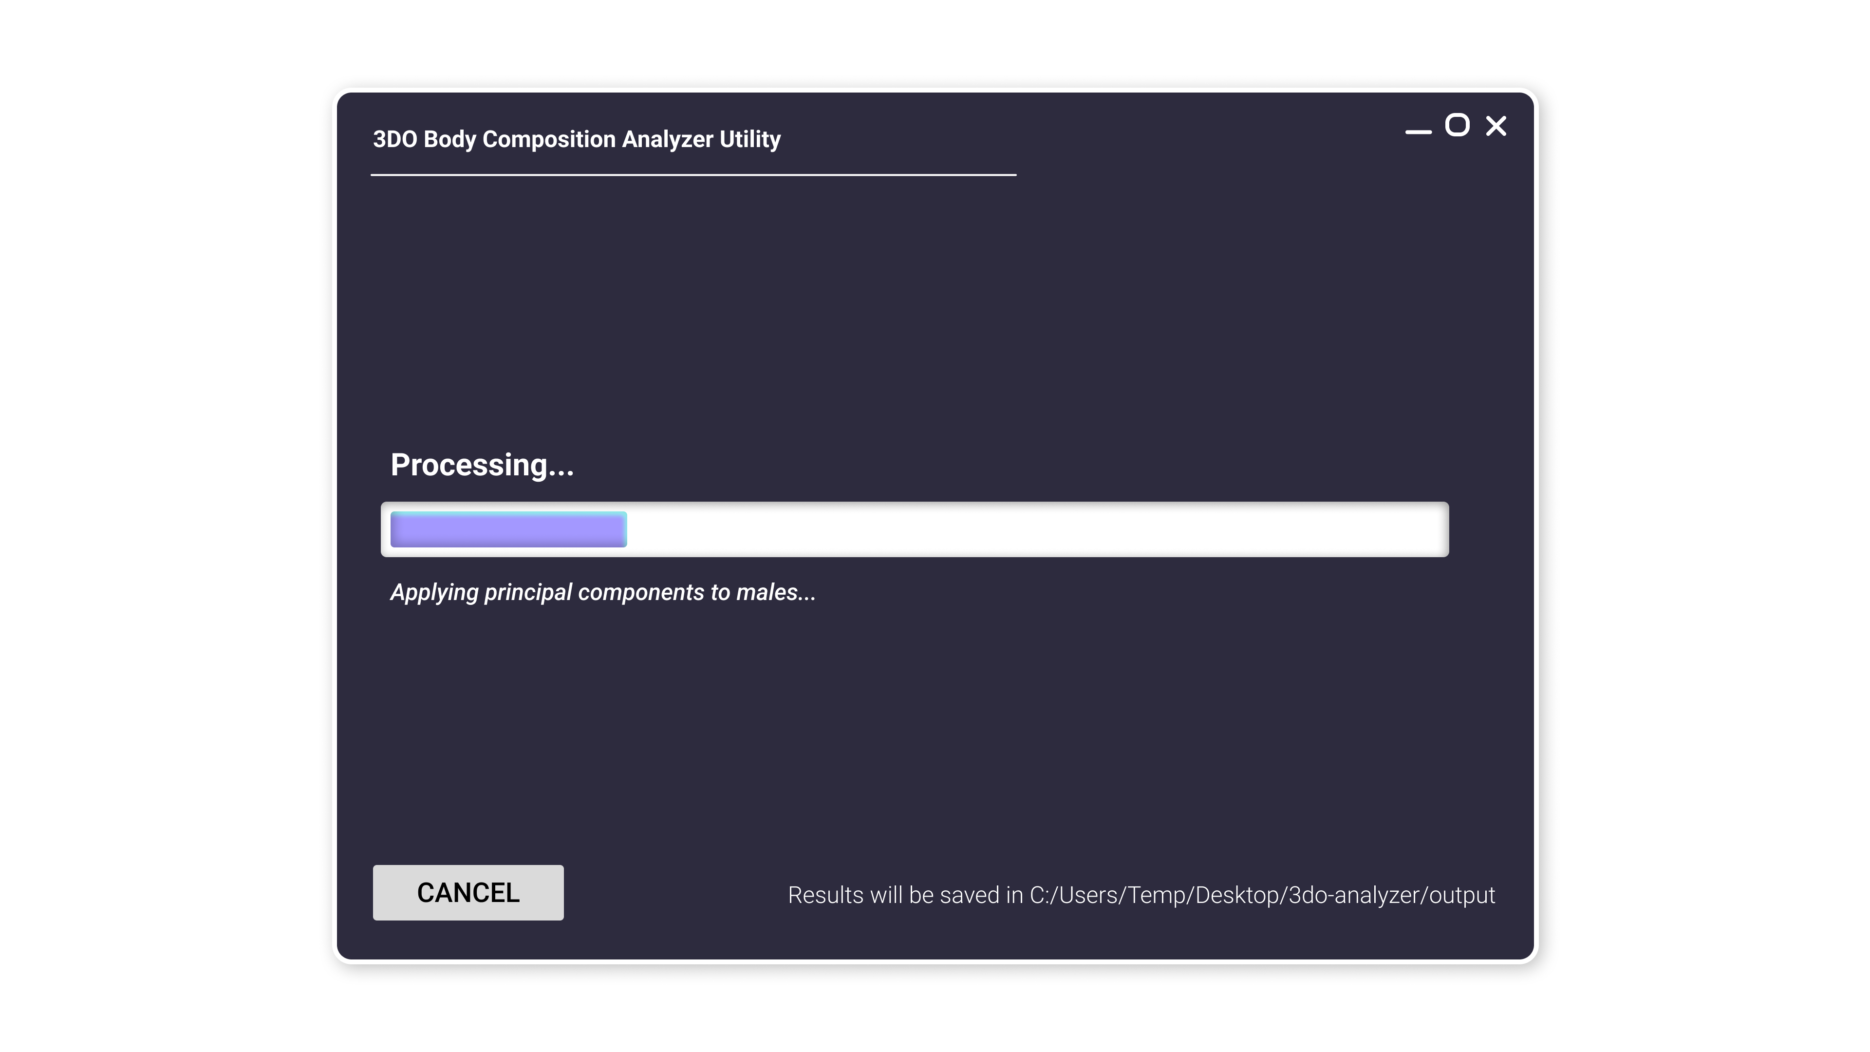
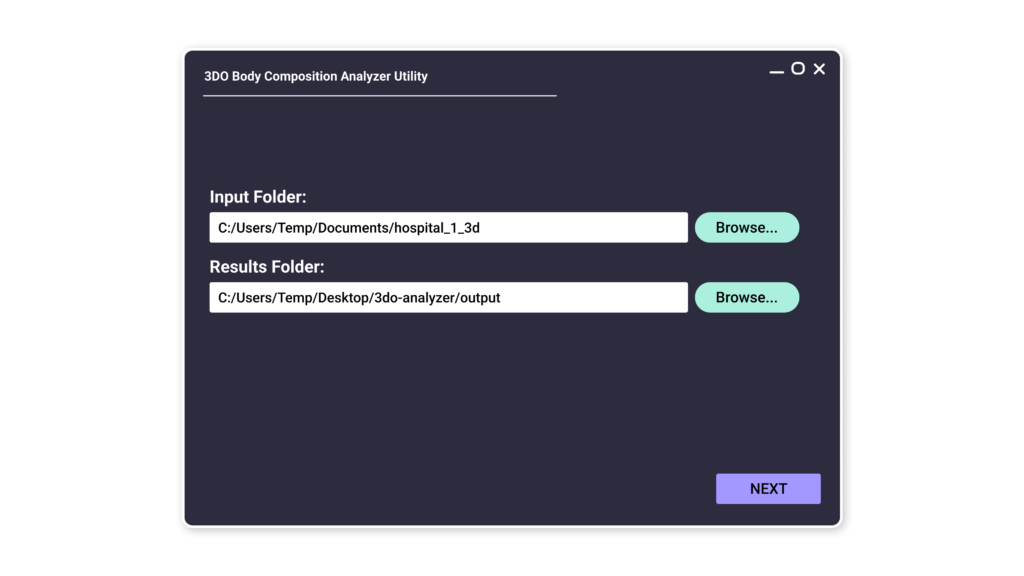
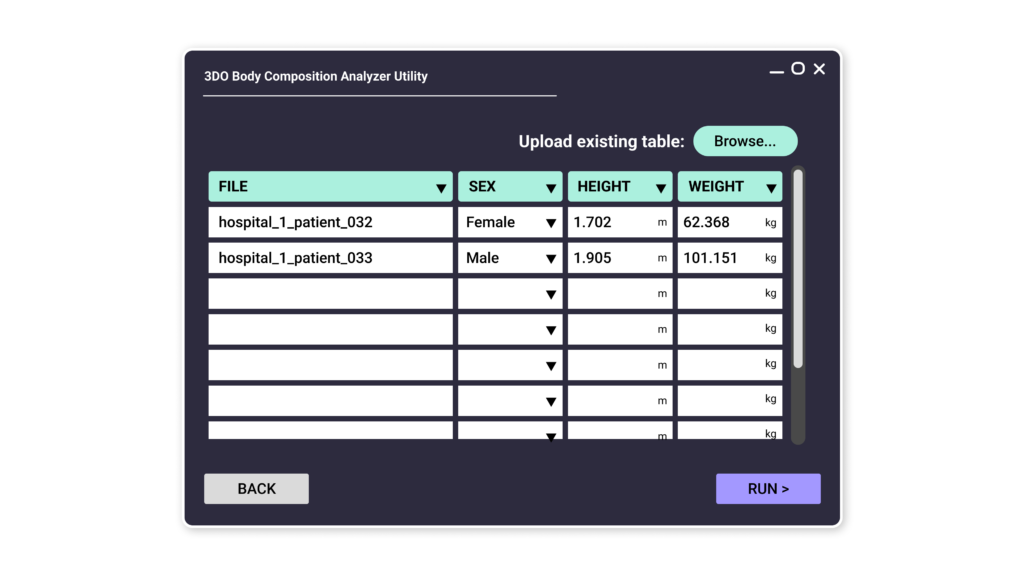
Once the technical workflow was simplified, I designed a graphical interface that removed the need to interact with the command line entirely. The interface guides users through selecting scan files, entering patient information, and starting the analysis. During processing, the system displays short descriptions of each stage along with a progress bar so that users can see what the software is doing at any moment.
Finally, the application was packaged as a Windows executable so that researchers could run the tool without installing the full development environment.
Final Product
The final application transformed the original developer pipeline into a guided desktop tool designed around the researcher’s workflow.
Instead of configuring development environments and running scripts manually, users could open the application, select their scan data, and run the analysis through a simple interface. Status messages and progress indicators made the system’s behavior visible during processing, which helped users feel confident that the analysis was running correctly.
Impact & Insights
After the interface was implemented, the software was handed off to a researcher with limited programming experience but deep expertise in body composition analysis. Using the application, they were able to process a large dataset of 3D scans captured with a phone camera and successfully conduct a research study.
The work ultimately contributed to a publication demonstrating that body composition can be estimated using accessible scanning methods.
One insight became especially clear through this project:
A powerful algorithm is only valuable if the people who need it can actually use it.
By removing technical barriers and designing around the researcher’s workflow, the project allowed domain experts to focus on analysis rather than on configuring software environments. In practice, the most meaningful design work involved simplifying the system itself so that the technology could realistically be used in research settings.